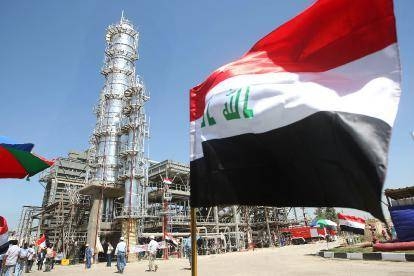
OIL EXPORTS
Barrels per day (bpd) is the daily average of monthly total exports as
reported by the Oil Ministry and SOMO. Price per barrel is the average of total
monthly revenue or a range.
Month Total bpd From Basra From Kirkuk $ per barrel
June'11 2.275 mln 1.726 mln 546,666 105.17
July 2.164 mln 1.709 mln 458,000 108.79
Aug 2.189 mln 1.728 mln 461,000 104.91
Sept 2.101 mln 1.767 mln 334,000 104.89
Oct 2.088 mln 1.628 mln 460,000 104.91
Nov 2.135 mln 1.712 mln 423,000 106.59
Dec 2.145 mln 1.733 mln 412,000 106.18
Jan'12 2.106 mln 1.711 mln 395,000 109.08
Feb 2.014 mln 1.639 mln 375,000 112.93
March 2.317 mln 1.917 mln 400,000 117.99
April 2.508 mln 2.115 mln 393,000 116.80
May 2.452 mln 2.086 mln 366,000 103.04
June 2.403 mln 2.085 mln 318,000 90.00
INFLATION
Data from Iraq's central bank
Month Core CPI y/y, pct change
May'11 6.3 pct
June 6.4 pct
Jul 7.1 pct
Aug 7.6 pct
Sept 7.3 pct
Oct 6.9 pct
Nov 6.4 pct
Dec 7.0 pct
Jan'12 6.1 pct
Feb 6.3 pct
March 6.1 pct
April 6.7 pct
May 6.2 pct
Core consumer price index excludes expenditure on oil, gas and petrol and
transport. Included components are food, rent, tobacco and drinks, clothes,
furniture, medicines and medical services.
UNEMPLOYMENT
Data from COSIT
Year Rate
2006 17.50 percent
2007 –
2008 15 percent, with 30 percent partial employment
2011 11 percent, with 20 percent partial employment
POLICY INTEREST RATE
Date Rate changed to
2010
April 1 6 pct
BUDGET EXPENDITURE
2012 budget — $100.5 bln
2011 budget — $82.6 bln
2010 budget — $72.4 bln
2009 budget — $58.6 bln**
2008 budget — $48 bln + $21 bln supplementary
2007 budget — $41 bln
Reuters
13 July


